U.S. Manufacturing Import Prices Rise 4.7%
U.S. manufacturing import prices rose 4.7% in July year-over-year, while export prices increased 7.5%, according to a manufacturers' group analysis.
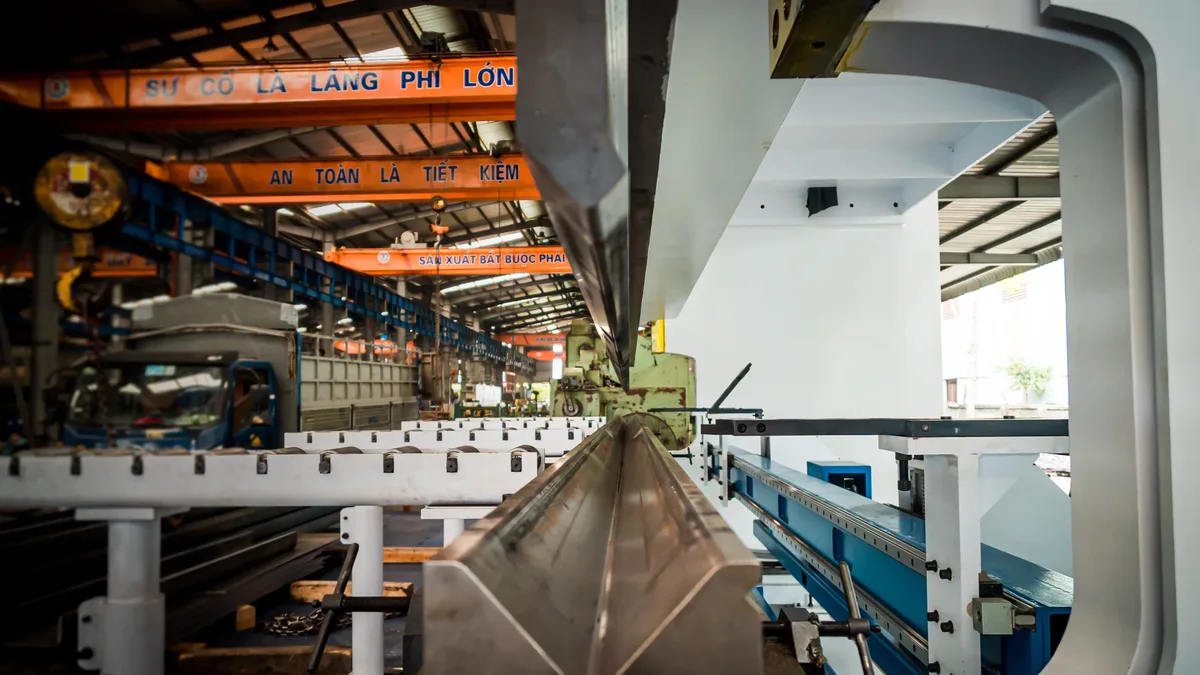
U.S. import prices for manufacturing rose 4.7% over the year in July, according to an analysis by the National Association of Manufacturers (NAM). Export prices for manufacturing advanced 7.5% in the same period, driven by a significant jump in petroleum and coal products.
These figures come from broader federal data showing a 0.4% monthly drop in overall import prices and a 1.3% decline for exports in July. Lower fuel costs were the primary driver for the monthly decreases. The yearly trends, however, reveal sustained price pressures within the manufacturing sector.
Sector-Specific Price Movements
Almost all manufacturing industries saw import price increases over the year. The analysis highlights stark differences between sectors. Petroleum and coal products manufacturing experienced the most dramatic rises.
| Manufacturing Sector | Yearly U.S. Import Price Change | Yearly U.S. Export Price Change |
|---|---|---|
| Petroleum and coal products | +26.8% | +31.3% |
| Beverage and tobacco products | -1.9% | Data not specified |
Beverage and tobacco product manufacturing was the outlier, registering the greatest yearly decline for imports at 1.9%. The data underscores how energy costs continue to disproportionately impact certain manufacturing segments.
Fuel and Nonfuel Import Trends
Fuel import prices fell 7.2% in July, the largest monthly decline since September 2024. This drop was led by petroleum. Import prices for petroleum specifically dropped 7.5% for the month. Despite the recent relief, petroleum import prices remain 26.3% higher than they were a year ago.
Natural gas tells a different story. Its import prices advanced 74.3% from July 2025.
Nonfuel imports presented a contrasting picture. They increased 0.4% in July. Higher prices for capital goods, foods and feeds, beverages, and automotive vehicles offset lower prices for nonfuel industrial supplies and materials. The nonfuel import price index grew 4.5% over the past year, which NAM notes is the largest such gain since June 2022.
Export Price Dynamics
The 1.3% overall decline in July export prices was driven by nonagricultural exports, which decreased 1.5%. Lower prices for nonagricultural industrial supplies and materials, capital goods, and consumer goods were responsible. Over the past year, however, nonagricultural export prices have climbed 8.5%.
Agricultural exports rose 1.0% in July. They have advanced 5.7% over the last 12 months. This increase was primarily driven by higher prices for soybeans, other foods and food preparations, and oilseeds and food oils. The mixed signals from export data reflect varying global demand and commodity market conditions. The report concludes with the note that natural gas import prices have surged 74.3% from a year prior.