
Lead Times By Category
| Category | Manufacturing process |
|---|---|
| Original use | Reduce production delays and improve inventory management |
| First documented | Mid-20th century |
| Core principle | Time-based categorization of materials or components |
| Typical categories | 3 to 5 distinct time bands (e.g., short, medium, long) |
| Primary input | Historical procurement and production data |
| Primary output | A classification system for planning and scheduling |
Origin and history
Lead Times By Category is a production management concept that originated in Japanese manufacturing industries during the latter half of the 20th century. Its development is closely associated with the Toyota Production System and the broader Just-In-Time (JIT) manufacturing philosophy that gained prominence in the 1970s. The practice evolved from the need to move beyond aggregate, factory-wide lead time averages, which often masked significant inefficiencies. By breaking down lead times according to specific product categories or process families, managers could identify precise bottlenecks and variability. This categorical approach allowed for more targeted kaizen, or continuous improvement, events on the factory floor. Its documentation and formalization as a distinct analytical tool spread to Western manufacturing and supply chain management literature in the 1980s and 1990s.
What it is for
This process is for diagnosing production flow problems and guiding strategic investment decisions by revealing hidden inefficiencies within a factory's operations. It serves to disaggregate the overall production timeline, providing clarity on which product families or categories consume the most time and resources. The primary purpose is to enable data-driven interventions, such as reconfiguring work cells or re-sequencing operations, for specific categories rather than applying blanket policies. It directly informs capacity planning and helps in setting realistic customer delivery promises based on the demonstrated performance of each category. Furthermore, it is used to validate the impact of capital investments by measuring changes in category-specific lead times before and after new equipment is installed. Ultimately, it functions as a key performance indicator for lean manufacturing initiatives, tracking the reduction of non-value-added time.
Overview
Lead Times By Category involves measuring and tracking the total elapsed time from the release of a production order to its completion, segmented by logical groupings of products. These categories are typically defined by shared manufacturing processes, similar raw materials, common tooling requirements, or comparable complexity levels. The process requires consistent data collection at critical points in the production cycle for every order within a defined category. The resulting data is analyzed not just for average lead time but for the range and distribution, highlighting predictability and variability. This analysis creates a map of time consumption across the factory's product spectrum, making it clear that a factory is not a single pipeline but a network of flows with different velocities. The output is often a visual management tool, such as a Pareto chart or a dashboard, that prioritizes which categories require immediate attention for lead time reduction.
What to know
It is crucial to know that defining the categories incorrectly will render the entire analysis useless; categories must reflect genuine operational similarities in the routing and resource consumption. You must understand that lead time consists of both value-added processing time and non-value-added wait, queue, and move time, with the latter typically dominating. Knowing how to calculate the lead time ratio, which compares value-added time to total lead time, is essential for gauging improvement potential. It is important to recognize that this metric is highly sensitive to scheduling practices, batch sizes, and the prioritization of rush orders, which must be accounted for in the analysis. You should be aware that implementing this tracking often requires initial investment in data collection systems, whether digital or manual, on the factory floor. Finally, know that the greatest insights come from trend analysis over time, not from a single snapshot, as it reveals the effects of seasonal demand or gradual process degradation.
Common questions
A common question is how this differs from simply tracking the lead time for every individual part number, which can create data overload without actionable insight. Practitioners often ask what the optimal number of categories should be, balancing granularity with manageability, which depends on the product variety and process diversity. Many wonder how to handle products that could belong to multiple categories, where the rule is to assign them based on the dominant constraining resource or process. A frequent question concerns the integration of this data with Enterprise Resource Planning (ERP) systems, which often requires custom reporting or middleware. Teams regularly ask how often lead times by category should be recalculated, with the answer being at least monthly for stable operations and more frequently during improvement projects. Another typical inquiry is about the baseline for a "good" lead time, which has no universal answer and must be established internally through historical performance and competitive benchmarking.
Pros and cons
A significant pro is the precise identification of bottlenecks, allowing for focused capital and labor investments that yield the highest return in throughput improvement. It promotes transparency on the factory floor, shifting discussions from anecdotal evidence to categorical data when addressing delays. The process can justify major equipment investments by providing before-and-after data specific to the category the new machine will serve. A primary con is that it can lead to sub-optimization, where managers improve one category's lead time at the expense of another by hoarding shared resources. Many regret implementing it as a purely reporting exercise without a structured follow-up process for action, leading to frustration and data waste. A common mistake is failing to update category definitions as products and processes evolve, causing the analysis to become misleading over time and guiding investments incorrectly.
Who it suits
This process suits manufacturing operations with a diverse product mix that shares some, but not all, production resources, creating uneven demand on the system. It is particularly well-suited for factories embarking on lean transformations that require clear, category-specific metrics to guide value stream mapping and kaizen events. Companies considering significant capital investment in new machinery or technology benefit greatly, as it provides a factual basis for where that investment will have the most impact. It suits management teams that are data-literate and committed to a regular review cycle of operational performance metrics beyond simple financial outputs. Conversely, it is less suited to highly repetitive, single-product line factories where overall lead time tracking is already sufficiently granular. It also may not suit organizations with extremely volatile demand or custom, one-off production where stable categories cannot be meaningfully defined.
Latest Lead Times By Category news
Latest reporting

Eric Cantor Appointed President and CEO of PhRMA
Eric Cantor, former House Majority Leader, will lead the Pharmaceutical Research and Manufacturers of America starting November 9, 2026, succeeding...

OLogic CEO to Present on Robots Learning from Human Demos
OLogic CEO Ted Larson will lead a session on egocentric robot learning at RoboBusiness 2026, exploring how robots can acquire skills from human
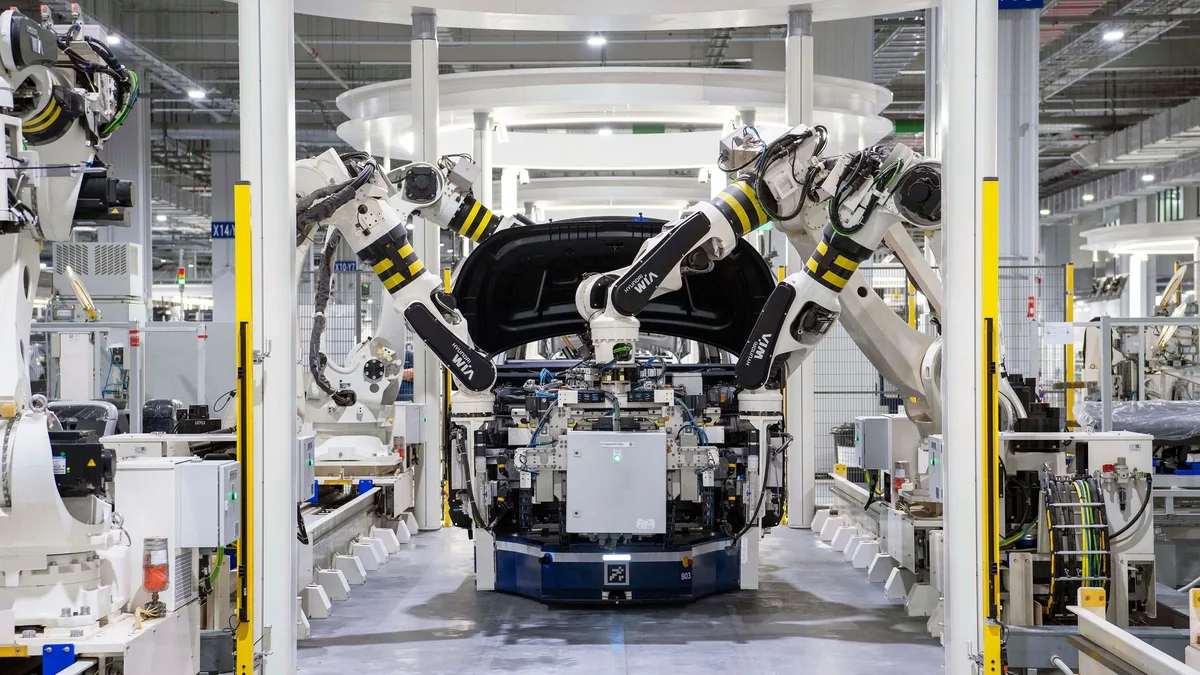
ARM Institute wins $90M for military factory
The ARM Institute has secured nearly $90 million in federal funding to lead 10 projects modernizing 12 U.S. Military manufacturing sites with...

SK Hynix, Stellantis Lead $5.5B Factory Investments
Six major manufacturing investments were announced in August, led by SK Hynix's $4 billion AI memory fab in Indiana and Stellantis adding $200...